
Bollinger Bands Indicator: A Complete Guide for Beginners
Introduction
Have you ever wondered how traders predict stock price movements? It might seem like magic, but in reality, they use tools like the Bollinger Bands indicator to make informed decisions. Whether you’re new to trading or looking to refine your strategies, understanding this tool can significantly boost your market insights. Let’s dive into the world of Bollinger Bands and see how they can enhance your trading experience!
Learn how the Bollinger Bands indicator helps in trading. Discover trading courses and the Best stock market course to master technical analysis.
What Are Bollinger Bands?
Bollinger Bands are a technical analysis tool developed by John Bollinger in the 1980s. They consist of three lines: a middle band (simple moving average) and two outer bands (standard deviations above and below the SMA). These bands help traders identify price volatility and potential trading opportunities.
How Bollinger Bands Work
Bollinger Bands expand and contract based on market volatility. When the market is volatile, the bands widen. When it’s stable, they contract. This movement helps traders anticipate price breakouts and reversals.
The Components of Bollinger Bands
Middle Band: A simple moving average (typically 20-period SMA)
Upper Band: SMA + (2 * standard deviation)
Lower Band: SMA – (2 * standard deviation)
Why Use Bollinger Bands in Trading?
Bollinger Bands provide critical insights into price trends. Traders use them to:
Spot overbought and oversold conditions
Identify breakout opportunities
Assess market volatility
Interpreting Bollinger Bands Signals
Price Touching the Upper Band: The asset may be overbought, and a reversal could occur.
Price Touching the Lower Band: The asset may be oversold, presenting a buying opportunity.
The Squeeze: When bands contract, it signals low volatility and a possible breakout.
Common Bollinger Band Strategies
Bollinger Bounce: When prices bounce between the bands.
Bollinger Breakout: Prices breaking above or below the bands indicate strong movement.
Double Bollinger Bands Strategy: Using two sets of Bollinger Bands to refine entry and exit points.
Limitations of Bollinger Bands
While Bollinger Bands are powerful, they’re not foolproof. They should be used with other indicators to confirm signals and avoid false breakouts.
Combining Bollinger Bands with Other Indicators
RSI (Relative Strength Index): Confirms overbought and oversold conditions.
MACD (Moving Average Convergence Divergence): Helps identify trend changes.
Volume Indicators: Confirms the strength of breakouts.
Best Stock Market Courses to Learn Bollinger Bands
To master Bollinger Bands, enroll in trading courses that offer hands-on experience. Some of the best stock market courses include:
Udemy’s “Technical Analysis for Beginners”
Coursera’s “Stock Market Fundamentals”
Investopedia Academy’s “Technical Analysis Course”
Tips for Beginners Using Bollinger Bands
Start with a demo account before trading real money.
Use Bollinger Bands alongside other indicators for accuracy.
Avoid over-relying on a single indicator for decision-making.
Mistakes to Avoid When Using Bollinger Bands
Misinterpreting price movements as guaranteed signals.
Ignoring overall market trends.
Using Bollinger Bands alone without other technical tools.
Case Study: Real-World Application
A trader used Bollinger Bands to analyze Apple’s stock. When prices touched the lower band, the trader entered a long position. As expected, the price rebounded, leading to a profitable trade. This example showcases how Bollinger Bands can be applied effectively.
Conclusion
Bollinger Bands are a powerful tool for traders looking to analyze market trends and price volatility. While they’re not a crystal ball, they offer valuable insights when used correctly. By integrating Bollinger Bands into your trading strategy, you can make more informed decisions and improve your trading performance.
Frequently Asked Questions (FAQs)
Can Bollinger Bands be used for all types of trading?
Yes! Bollinger Bands can be applied to stocks, forex, crypto, and even commodities.
What is the best setting for Bollinger Bands?
The standard setting (20-period SMA with 2 standard deviations) is widely used, but traders can adjust it based on their strategy.
Do Bollinger Bands work in a sideways market?
Yes, but they are more effective in trending markets. In a sideways market, they help identify breakouts.
Can I use Bollinger Bands for day trading?
Absolutely! Many day traders use them to spot short-term price movements and trade opportunities.
Where can I learn more about Bollinger Bands?
You can enroll in trading courses like Udemy or Coursera, or check out the best stock market courses online.
Bollinger Bands Indicator Explained – Best Stock Market Course
trendytraders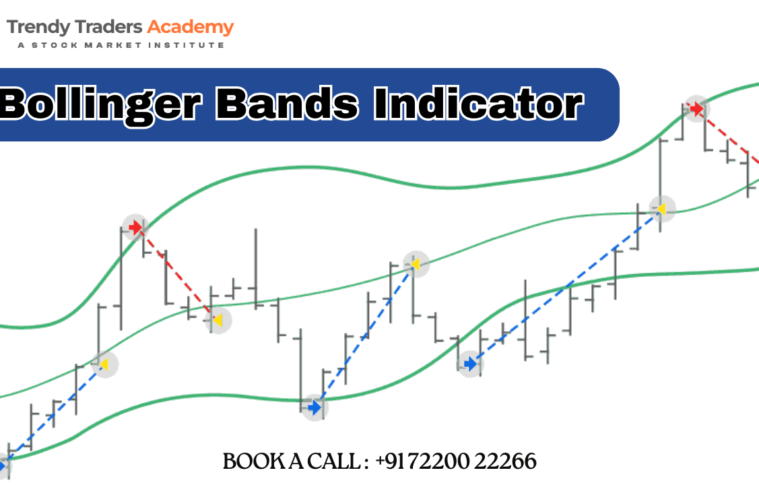


Leave a comment